
Where the $36-per-$1 email ROI figure comes from, why it fails as a plan, and how to measure your own with full costs, click attribution and a holdout.

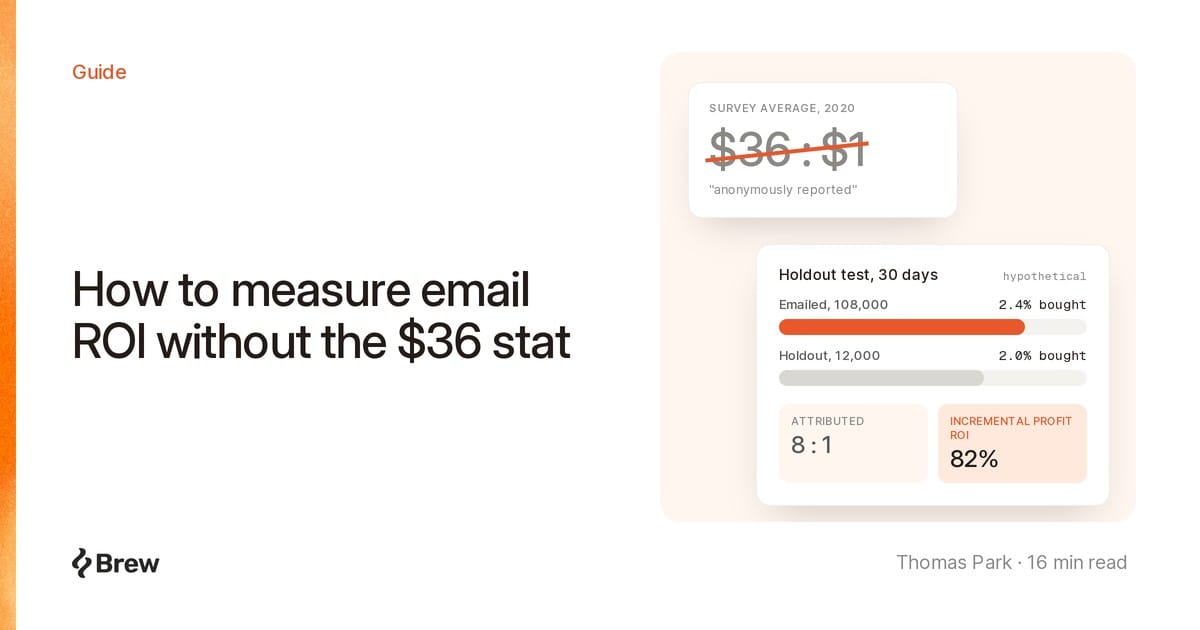
Email ROI is the profit your email program produces compared with what it costs to run. Most decks quote "$36 for every $1 spent", a survey average of what marketers said their return was. Nobody measured it, and it says nothing about your program.
Below: where the $36 comes from, and the method we use instead. Count every cost, fix attribution rules in advance, and run a holdout to see what email caused.
It traces to two marketer surveys: Litmus in the US and the Data & Marketing Association (DMA) in the UK.
Litmus published "38:1" in 2018. Its post The ROI for Email Marketing: The Good News and the Bad News credits "a Litmus survey of 372 marketers worldwide" and says only 30% of brands could measure email ROI "well or very well". The October 11, 2018 press release says the research was "based on data from nearly 400 marketers worldwide".
In 2019 it rose to 42:1, per Why You Should Invest in Email Now More Than Ever. Then the State of Email Report, Fall 2020, a survey of over 2,000 marketing professionals, said:
"the anonymously reported ROI of email programs fell. It decreased from 42:1 in 2019 to 36:1 in 2020."
That is the $36. A few pages later the report adds that "less than one-quarter believed their company measured the ROI of email marketing efforts well or very well", and "45% cited the measurement was poor, very poor, or non-existent."
Litmus still leans on it. Its email ROI page, modified June 2025, opens with "On average, email drives an ROI of $36 for every dollar spent." Its July 2025 ROI infographic says its figures "are derived from Litmus' 2020 State of Email Survey".
The DMA's Marketer Email Tracker prints its question beside the chart: "How much is the approximate return you get back for every pound spent on email marketing?" The 2019 report and 2021 report give the answers below.
| Source | Published | Figure | Sample | Method |
|---|---|---|---|---|
| Litmus, 2018 | Aug-Oct 2018 | 38:1 | 372 marketers ("nearly 400" in the release) | Survey |
| Litmus, 2019 | Aug 2019 | 42:1 | Not stated | Survey |
| Litmus, State of Email Fall 2020 | Sept 2020 | 36:1 | Over 2,000 marketers | "Anonymously reported" |
| DMA Marketer Email Tracker 2019 | 2019 | £42.24 per £1 | 197 UK marketers, Jan 2019 | Online survey, "approximate return" |
| DMA Marketer Email Tracker 2021 | 2021 | £38.33 per £1 | 213 UK marketers, Apr 2021 | Online survey, "approximate return" |
It is self-reported. Each data point is a marketer's guess, from a group where fewer than a quarter said they measured ROI well. Averaging guesses does not make a measurement.
Nobody defined revenue. One respondent may count any order within 30 days of an open, another only clicked orders within 24 hours. If you get something other than 36, you cannot tell whether your program is worse or your rules stricter.
It is an average, not a marginal return. Chad White, then Litmus's research director, said in the 2018 release that "these sky-high ROIs are actually a sign of mismanagement," and companies should invest until ROI drops "somewhere closer to 20:1, if not lower." Budgets turn on the next dollar's return, which is usually lower.
The publisher sells email tools. The CMO's Guide to Email ROI uses the same survey data to say brands using Litmus Email Analytics "generate an ROI of 45:1 on average." Maybe true. Also marketing. Treat the series as vendor research.
Use one period for costs and revenue, usually a month. These four lines matter most. Our email marketing ROI post has a longer checklist.
| Cost line | How to calculate it | Common mistake |
|---|---|---|
| Platform | Monthly ESP fee plus overages, dedicated IPs and paid add-ons | Counting only the base plan |
| People | Monthly email hours times a loaded hourly rate (salary plus overhead) | Leaving out review, QA and engineering time |
| Creative and tools | Design tools, image licenses, testing and analytics tools, agency or freelance fees, prorated if shared | Charging shared tools 100% to email |
| List acquisition | Lead magnets, signup incentives and paid list growth, spread over a subscriber's expected lifetime | Leaving it out because it sits in another budget |
Email-only discounts count too, either here or subtracted from revenue, not both.
Attributed revenue is what your tools credit to email under a rule you chose. It proves nothing about cause, but you get it for every send.
A rule sets which interaction earns credit (click, open or delivery) and how long afterward an order still counts. Defaults vary. Klaviyo's attribution docs say new accounts use last-touch with "5 days for email clicks" and "5 days for email opens". Google Analytics 4 defaults to a 90-day lookback for most key events and data-driven attribution as the model. So your ESP and GA4 will disagree, and neither is broken.
We'd use click-based last-touch, with a window that matches how long customers take to buy: 1 to 5 days for impulse ecommerce, 14 to 30 for considered purchases and SaaS trials. Write the rule on every report and leave it alone mid-quarter.
Apple announced Mail Privacy Protection on June 7, 2021, saying it "stops senders from using invisible pixels to collect information about the user." Per Apple's privacy page, Protect Mail Activity "downloads remote content in the background by default, regardless of whether you engage with the email."
So open-based windows credit email with orders from people who may never have seen it. Klaviyo's conversion tracking article says "Conversions are tracked if someone opens or clicks, or if Apple Mail Privacy Protection (MPP) automatically opens the email," and offers a setting to exclude MPP opens. Check your tool's equivalent, or drop opens entirely. Our post on email metrics covers what opens still tell you.
Google's campaign URL guide lists utm_source, utm_medium and utm_campaign, with "email" as an example medium. Use them on every link, consistently:
https://example.com/spring?utm_source=newsletter&utm_medium=email&utm_campaign=2026-03-spring-sale&utm_content=hero-buttonThese four compare sends, months and segments on equal terms.
Revenue per recipient (RPR)       = attributed revenue / delivered emails
Revenue per 1,000 delivered (RPM) = RPR x 1,000
Revenue per send                  = attributed revenue credited to one send
Revenue per subscriber per month  = email revenue in the month / average subscribed contacts
Divide by delivered, not sent, so bounces do not drag RPR down. Revenue per subscriber per month is the most useful, since you can set it against what a subscriber costs to acquire.
A holdout (or control group) is a random slice of your list you deliberately do not email. After a fixed period, the difference in purchases per person, times the emailed group's size, is the revenue email caused. Attribution shows who clicked before buying. A holdout shows what would have happened anyway.
Size depends on baseline purchase rate and the smallest lift you care about. Braze's control group guidance says no smaller than 1,000 users and no more than 10% of the audience, up to 15% for audiences under 10,000. That is a floor. The table uses a standard two-proportion test at 95% confidence and 80% power; Evan Miller's calculator reproduces the equal-split numbers, and our A/B testing guide applies the same logic to sends.
| Baseline 30-day purchase rate | Lift to detect | Per group, 50/50 split | Total list, 10% holdout | Total list, 5% holdout |
|---|---|---|---|---|
| 2% | 10% (2.0% to 2.2%) | 80,700 | 431,500 | 813,600 |
| 2% | 20% (2.0% to 2.4%) | 21,100 | 108,900 | 204,400 |
| 2% | 30% (2.0% to 2.6%) | 9,800 | 48,900 | 91,300 |
| 5% | 10% (5.0% to 5.5%) | 31,200 | 167,300 | 315,400 |
| 5% | 20% (5.0% to 6.0%) | 8,200 | 42,200 | 79,200 |
A 20,000-person list should test the whole program, not a subject line. A few big orders swing revenue per subscriber, so test on purchase rate and report revenue with its range.
Run at least one purchase cycle, and never under four weeks. Re-randomize every quarter or two so the same people are not shut out forever. Keep it at 5 to 10%, since it forgoes roughly its size times incremental revenue per subscriber.
Every number here is invented, not a benchmark.
A store with 120,000 subscribers holds out 12,000 (10%) for 30 days and emails the rest as usual: four campaigns plus automations. Average order value is $75, gross margin 45%.
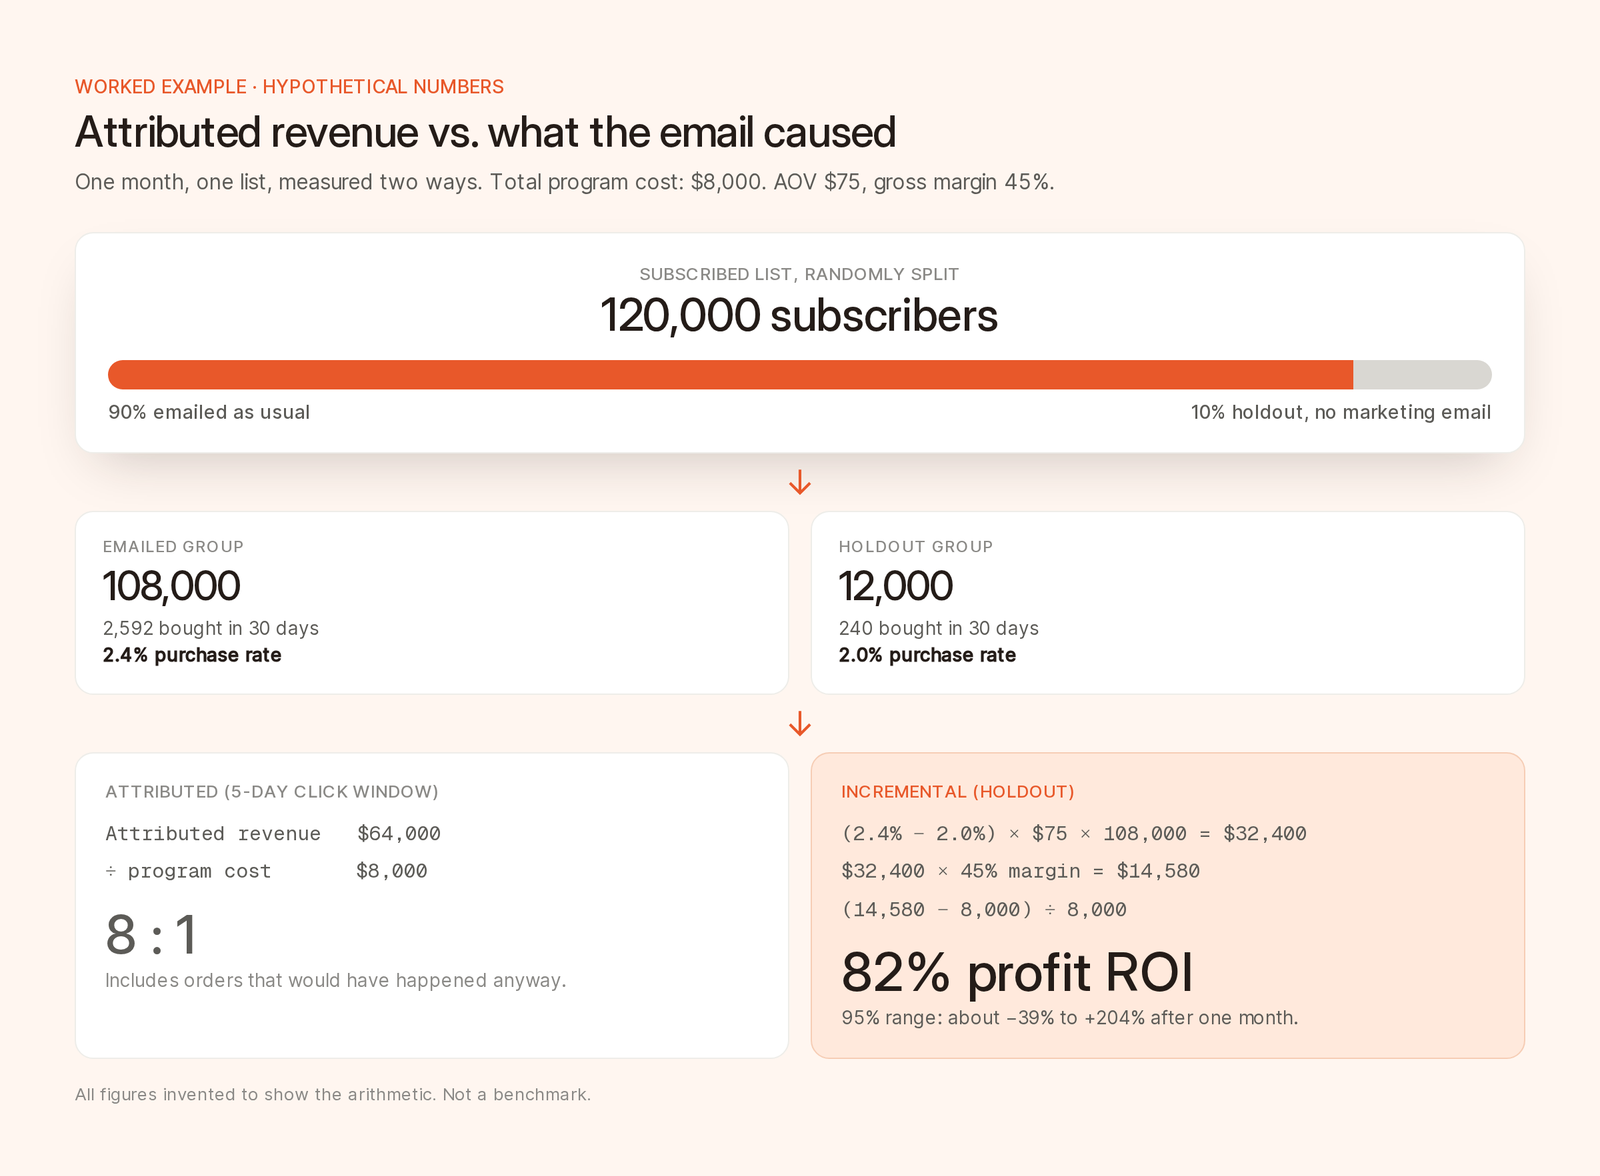
One month, two measurements. Attribution credits email with $64,000. The holdout says it caused about $32,400.
COSTS (month)
  Platform                          $1,000
  People: 60 h x $85                $5,100
  Creative and tools                  $600
  List acquisition, amortized       $1,300
  Total cost                        $8,000

ATTRIBUTED (5-day click window, from the ESP)
  Attributed revenue               $64,000
  Delivered emails                 420,000
  RPR = 64,000 / 420,000            $0.152   (RPM $152)
  Revenue per subscriber/month      $0.59    (64,000 / 108,000)
  Revenue ratio = 64,000 / 8,000    8:1

INCREMENTAL (all orders, from the store)
  Emailed group purchase rate        2.4%    (2,592 of 108,000)
  Holdout purchase rate              2.0%    (240 of 12,000)
  Incremental revenue per emailed subscriber
    = (0.024 - 0.020) x $75          $0.30
  Incremental revenue = 0.30 x 108,000      $32,400
  Incremental gross profit = 32,400 x 0.45  $14,580
  Incremental profit ROI = (14,580 - 8,000) / 8,000 = 82%
Attribution says 8:1. The holdout says email returned $1.82 in gross profit per dollar spent. Plan with the second.
The caveat: with 12,000 held out, the 95% interval on the purchase-rate difference is about 0.13 to 0.67 percentage points, roughly $10,800 to $54,000 of incremental revenue. That spans about -39% to 204% profit ROI, and it treats order value as fixed, which it is not. One month says email very likely adds revenue, not yet that it pays for itself. A few more months narrow the range.
Monthly numbers undercount email when its effect builds through repeat purchases, churn or renewals. A long-running holdout catches that over 6 or 12 months:
LTV uplift per subscriber = (12-month revenue per emailed subscriber
                             - 12-month revenue per holdout subscriber) x gross margin
Incremental revenue per subscriber also prices list growth. In the example, a subscriber is worth $0.30 x 45% = $0.135 of gross profit per month. At $2.00 to acquire one, payback takes about 15 months. Check your churn and unsubscribe rates before buying growth.
Brew supplies the engagement side of this method. Your store or billing system supplies revenue.
Engagement reporting. The analytics overview covers sent, delivered, opened, clicked, bounced, complained and unsubscribed, with rates for each. Open counts exclude machine opens, and click counts exclude bot clicks. Agents get the same numbers from the get_email_analytics MCP tool, code from /v1/analytics. See the reading analytics docs.
Revenue lives in your own analytics. Per the key metrics docs, conversions "are tracked in your own analytics platform, not in Brew." Tag links with UTMs and count orders in GA4 or your store.
Joining clicks to orders. The events report (get_email_analytics or /v1/analytics/events) returns one row per event with time, event type, recipient, send and email. Join the click rows to orders by email address and timestamp to apply your own window.
Order data on contacts. The Shopify and Stripe integrations trigger automations from store and billing events and sync fields like shopify_last_order_total, shopify_last_order_at and stripe_lifetime_value_cents onto each contact. Use them for segmenting and sanity checks, not attribution.
Holdouts. The automation Split node routes by filter rather than random percentage, so generate the random flag in your own data, write it to a custom contact field (CSV import or POST /v1/contacts), and exclude it from sending audiences.
That is the average of what marketers reported in Litmus's 2020 State of Email survey, not a measured result. In the same report, fewer than a quarter said their company measured email ROI well. Yours could be far higher or lower.
Any program whose incremental gross profit exceeds its full cost (profit ROI above 0%) pays for itself. Published averages use undefined revenue rules, so track your own month over month with fixed definitions.
The profit version is (incremental gross profit minus email program cost) divided by email program cost. With only attributed revenue, report (attributed revenue minus cost) divided by cost, labeled with its attribution window. A holdout supplies the incremental figure.
A click-based window that matches your purchase cycle, typically 1 to 5 days for impulse ecommerce and 14 to 30 days for considered purchases or trials. Skip open-based windows, because Apple Mail Privacy Protection loads tracking pixels whether or not anyone reads the email.
Large enough to detect the lift you care about. At a 2% purchase rate, finding a 20% lift with 95% confidence and 80% power needs about 10,900 people in a 10% holdout, out of roughly 109,000 total. Braze's guidance of at least 1,000 people and at most 10% of the audience is a floor, not a guarantee.